 Share This Page
| Home | | Mathematics | | Graphinity | | Share This Page |
An online graphing resource written in JavaScript.
— P. Lutus — Message Page —
Copyright © 2008, P. Lutus
Version 1.0, 11/05/2008.
(double-click any word to see its definition)
Introduction
This online JavaScript application is one of many graphing applications I've written over the years, and it's the online version of "Graphinity," a Ruby application with the same name and purpose — which is to make it as easy as possible to graph mathematical functions and then play with them.
One of the novel ways Graphinity lets you play is by providing user-defined variables that can be included in your entered functions, and whose values can be changed with a spin of your mouse wheel. Each time you change a value, the graph is redrawn — in real time — to show the effect of your input.
Complete documentation appears below the application. Enjoy!
The Application
| y(x) = |
| Minimum | Maximum | Grid Steps | Label | Index | |
| X | X | ||||
| Y | Y |
| Chart Title: | Plot Steps: | ||||
| Control A: | Control B: | Control C: | |||
| Line Thickness: | Chart Width: | Chart Height: | |||
The Joy of Graphing
It's no exaggeration to say that charts allow you to see mathematics. I can't remember how many times I have finally understood something mathematical only after seeing a picture. Charts like those created by Graphinity are a quick and easy way to get a picture.
But there's more. With Graphinity, you can adjust mathematical variables in a very easy way — by spinning your mouse wheel. Here's an example (spin your mouse wheel over the numbers):
number operator number result = 1. In this simple example, you can enter numbers the old-fashioned way, or you can put your mouse cursor over the numbers and spin your mouse wheel. Remember that much of real mathematics is exploration, and exploration should be fun as well as educational.
Graphinity's numerical inputs work the same way as this example — you can change the properties of the chart with ordinary entries or with mouse control.
Examples
Please remember that the user can type virtually any function into Graphinity. But, knowing what I do about people, I have prepared some example charts that will be loaded and run in Graphinity at the press of a button. For each example, pressing the button at the right will load the example and move you to the Graphinity display, where you can play with the chart's values. When you're done, just press your browser's "Back" button to come back to this location. Here are the examples:
Fourier/Taylor Series Periodic WaveformsRoot Finding and Others
Name/Equation Comments Square Wave Where: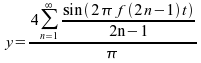
- f = frequency, Hertz
- t = time, seconds
This is a Fourier Series example. It shows that virtually any periodic waveform can be created out of individual sinewave components. Adjust the value of "Control A" to increase or decrease the number of generated harmonics and the degree to which the result resembles a square wave. Triangle Wave Where: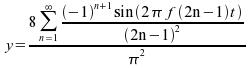
- f = frequency, Hertz
- t = time, seconds
Another Fourier Series example. Because of the absence of abrupt transitions in this waveform, fewer harmonics are required to create a reasonable synthesis.
Sawtooth Wave Where: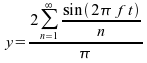
- f = frequency, Hertz
- t = time, seconds
Because of its abrupt transition, a sawtooth waveform is one of the most difficult to synthesize and many terms are required to begin to resemble an ideal sawtooth.
Rectified Sinewave Where: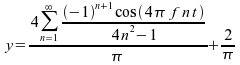
- f = frequency, Hertz
- t = time, seconds
This example has been much studied in electrical engineering because of its connection with AC power supply design. Obviously one can get a similar outcome using "abs(sin(x))", but this formal expression allows detailed analysis of the higher-order harmonics.
Amplitude Modulation Where:
- cf = carrier frequency, Hertz
- mf = modulation frequency, Hertz
- ml = modulation level
This represents the mathematical expression of an AM (Amplitude-Modulated) radio transmitter's output waveform. It wasn't so long ago that this transmission mode represented the pinnacle of technical sophistication, but by modern standards it seems rather crude and wasteful.
Frequency Modulation Where:
- cf = carrier frequency, Hertz
- mf = modulation frequency, Hertz
- ml = modulation level
This is what an FM (Frequency-Modulated) radio waveform looks like. A full analysis of an FM radio waveform is more complex than other similar modulation schemes because the relationship between required bandwidth and information content is difficult to express concisely.
Sine Series Where: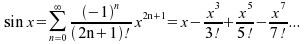
- x = argument, radians
This is a bit more complex than some of the other examples — it presents the Taylor Series for a sinewave, the primary method by which a computer produces a sine approximation. This example shows how many terms are required to extend the valid domain of the function much beyond the range {- ...
Name/Equation Comments Quadratic Equation 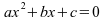
An important equation in the history of mathematics. Because a quadratic has two roots, the symbolic solution explicitly addresses this fact — — note the "±" symbol. This example lets the user see the behavior of the equation as different numerical values are applied, but more importantly, it shows another feature of Graphinity — if you click your mouse on the chart, the x and y values at that point will be displayed, which allows one to estimate the equation's real roots. Since I'm certain to be asked this by a student, this clicking and estimation approach can't be used to locate imaginary roots.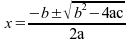
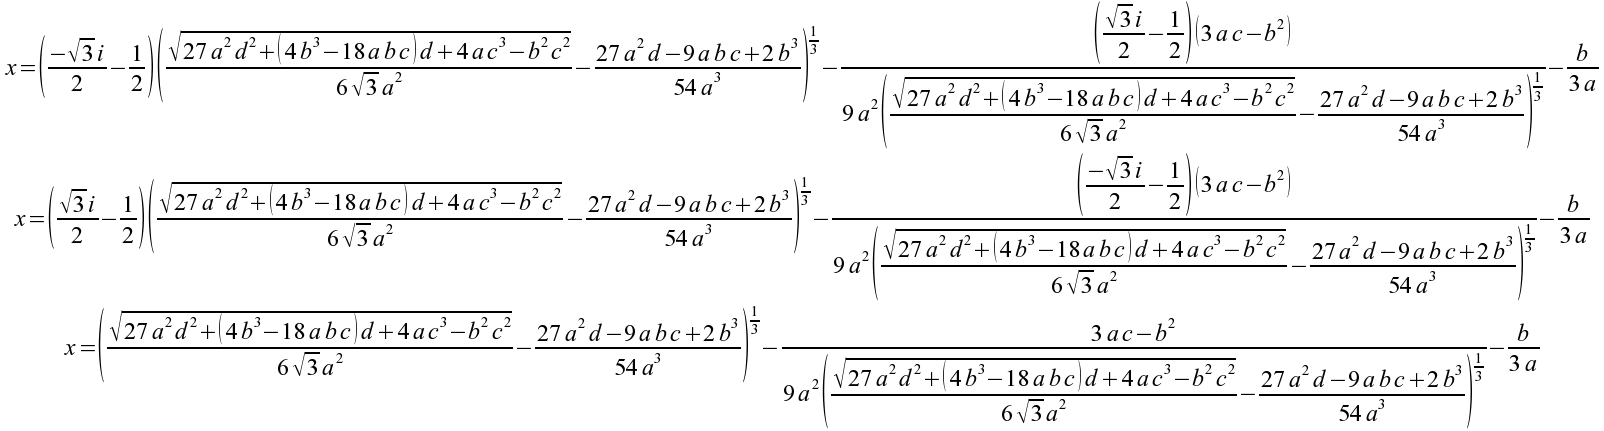
Cubic Equation 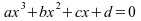
The general cubic equation has three roots and is formally soluble (click here to see how Maxima deals with it). This example revealed to me that, no matter how many variables one provides in a predefined form, there are never enough — the user has to type in a value for "d", and can use Graphinity's interactive features for a, b and c. Once you have the equation set up as you like, click the chart to estimate real root values (again, this method won't work for imaginary roots).
Gaussian/Normal Distribution Example Where: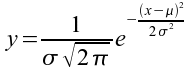
- μ = mean value
- σ = standard distribution
This example may help students of statistics visualize the interplay between the properties of a normal distribution. It was while preparing this example that I realized JavaScript doesn't have an erf(x) (Gaussian error) function, the integral of the normal distribution and much more useful for general statistical work.
Modular Arithmetic Example 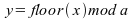
This example shows what kind of computer-oriented explorations Graphinity makes possible.
Robustness Example 
This example is just meant to show that Graphinity won't misbehave if confronted by an ill-behaved function.
Additional Notes
Be sure to enable cookies for Graphinity. This page saves all your entries and allows you to resume a project at a later time. Remember also that Graphinity saves its cookie in a particular browser, consequently it won't remember you if you change machines.
Unfortunately, I haven't figured out a way to copy the generated charts onto the clipboard. If you need to preseve a generated chart, press "Print Screen" and (on most operating systems) this will put an image of the entire desktop onto the clipboard or allow it to be saved as a file. On recent distributions of Linux, pressing Alt+Print Screen will copy the active application's image to the clipboard or save it to a file.
Because Microsoft Explorer doesn't support the "<canvas>" tag, Graphinity Online uses a library created by Google named "excanvas" to accommodate those few lost souls still using Microsoft's browser.
Supported Functions and Constants
Graphinity uses JavaScript's interpreter to process the user's equation entries, and it has its "Math" class exposed, meaning there is no need to prefix JavaScript's mathematical functions or constants with "Math.". The user can create any number of graphable equations using this collection of predefined functions and constants. Remember that trig functions use arguments expressed in radians (radian = degree *
Here is a list of supported functions:
abs(a) the absolute value of a acos(a) arc cosine of a asin(a) arc sine of a atan(a) arc tangent of a atan2(a,b) arc tangent of a/b ceil(a) integer closest to a and not less than a cos(a) cosine of a exp(a) exponent of a floor(a) integer closest to and not greater than a log(a) log of a base e max(a,b) the maximum of a and b min(a,b) the minimum of a and b pow(a,b) a to the power b random() pseudorandom number in the range 0 to 1 round(a) integer closest to a sin(a) sine of a sqrt(a) square root of a tan(a) tangent of a Here is a list of JavaScript's predefined constants:
E Euler's constant and the base of natural logarithms LN10 Natural logarithm of 10 LN2 Natural logarithm of 2 LOG10E Base 10 logarithm of E LOG2E Base 2 logarithm of E PI SQRT1_2 sqrt(1/2) or 1/sqrt(2) SQRT2 Square root of 2
Release Notes
This project is Copyright © 2008, P. Lutus and is released under the GPL.
- 11/05/2008 Version 1.0. Initial Public Release.
| Home | | Mathematics | | Graphinity | | Share This Page |